
Unlocking Next-Gen POS Forecasting for Biopharma Success
In the high-stakes world of biopharma, advanced Probability of Success (POS) forecasting can revolutionize the landscape of clinical trials. By adopting next-gen POS forecasting models, companies can significantly improve clinical trial accuracy, resulting in a 44% boost in predictive precision. Unlike traditional benchmarks, which consider only basic factors, a comprehensive, data-driven approach can better forecast clinical trial outcomes and optimize decision-making.
Limitations of Traditional POS Benchmarks
Conventional POS benchmarks typically rely on three core factors: molecule type (large vs. small), therapeutic area, and whether the trial is for a lead indication or a line extension. While these factors provide a foundational framework, they fall short in today’s complex clinical trial landscape. Relying solely on historical data overlooks other critical variables, potentially limiting the success of clinical trials and impeding strategic trial design.
Example: POS Benchmarks in Phase 2 Autoimmune Disease Trials
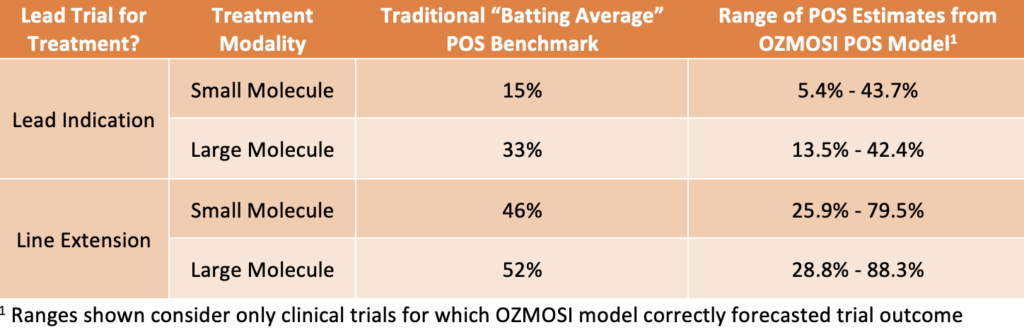
Table 1. – Comparison of traditional Phase 2 POS benchmark probabilities vs. range of predicted probabilities driven by multiple attributes that support accurate predictions of clinical trial success.
Consider Phase 2 clinical trials for autoimmune diseases. Traditional “batting average” benchmarks fail to account for the wide range of trial-level POS estimates. These benchmarks may provide an incomplete picture, leading to suboptimal trial designs and missed opportunities for success.
Harnessing the Power of Data and Machine Learning
Next-gen POS forecasting models incorporate large-scale data and machine learning (ML) techniques to integrate 14 factors into clinical trial models. These enhanced models deliver a deeper understanding of how trial design choices impact success rates, ultimately improving decision-making accuracy.
In a direct comparison between traditional benchmarks and our ML-based predictions, the latter showed a 44% improvement in accuracy. This improvement can be a game-changer for clinical trial planners working on multi-billion-dollar development plans. Additionally, our models allow for identifying which factors most influence POS, enabling more tailored and strategic trial designs.
Key Factors in Next-Gen POS Forecasting Models
Our next-generation POS models incorporate a wide range of factors, including:
- Investigational Drug Characteristics: Whether the drug is approved for other indications, its mechanism of action, and its modality.
- Trial Indication: Challenges posed by different diseases and the success rate of past trials targeting the same condition.
- Sponsor Experience: The sponsor’s track record in the targeted disease area and development phase.
- Trial Design: Factors such as monotherapy vs. combination therapy, the use of active comparators, trial duration, and patient enrollment numbers.
For example, in Phase 2 hematological drug trials, the predictive power distribution was as follows:
- Drug Characteristics: 37%
- Trial Indication: 2%
- Sponsor Experience: 23%
- Trial Design: 38%
Back-Testing and Predictive Accuracy
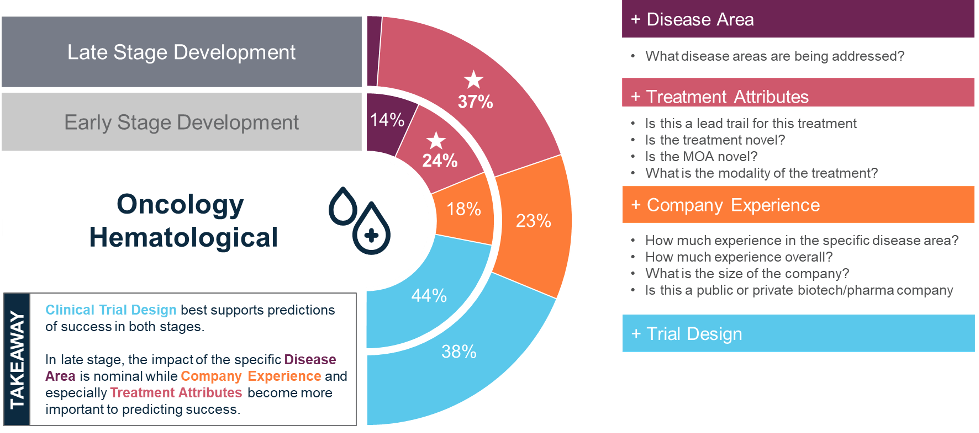
When back-tested, our next-gen POS models accurately predicted the outcomes of Phase 2 hematological trials 80% of the time, significantly outperforming traditional benchmarks. Notably, the factors influencing success varied across different trial phases and disease areas, emphasizing the need for customized POS models.
Illustration: Phase-Specific Variability in Predictive Power
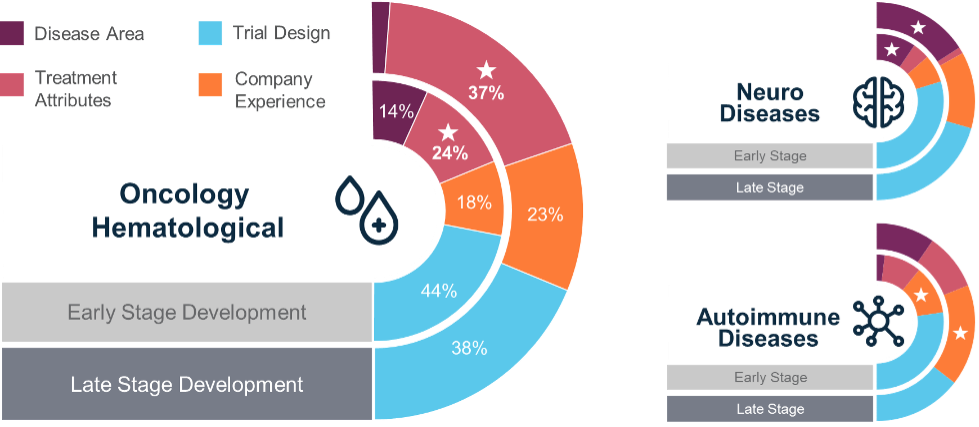
Our research found that the factors influencing the success of hematological drugs in Phase 2 trials differed from those in Phase 1 and Phase 3. This variability highlights the importance of context-specific forecasting models, as no single approach works for all trial phases.
Conclusion: Embracing Next-Generation POS Forecasting
The takeaway is clear: next-generation POS forecasting offers a more accurate and data-driven approach to predicting clinical trial success. By considering a broader and more relevant set of factors, biopharma companies can make better-informed decisions, reduce financial risk, and improve the likelihood of advancing new drugs through clinical trials.
Adopting these advanced models enables companies to leverage proprietary insights, ultimately enhancing their competitive edge. As the biopharma industry continues to evolve, embracing next-gen POS forecasting will be essential for those looking to lead in drug development. Now is the time to take advantage of this transformative approach.
OZMOSI’s Next-Gen POS Forecasting Model
At OZMOSI, our proprietary POS forecasting model integrates 14 critical factors, offering the most granular POS estimates available. Powered by BEAM, the cleanest clinical trial data source in the biopharma industry, our model draws from tens of thousands of trials. Whether you’re forecasting future trial outcomes or evaluating the risk-adjusted value of your R&D portfolio, our model is an indispensable tool for navigating the complexities of clinical trial planning.
Accuracy Comparison: Traditional vs. OZMOSI’s POS Forecasting Model
Using a holdout sample of resolved Phase 1-3 clinical trials, OZMOSI compared the accuracy of traditional benchmarks against our proprietary POS forecasting model. Our model demonstrated a 44% improvement in F-score, a widely accepted measure of predictive performance, confirming its superiority in forecasting clinical trial success.