Redefining Probability of Success in Pharma: A Data-Driven Revolution
In the world of pharmaceutical strategic planning and analytics, traditional Probability of Success (POS) forecasts are a familiar, yet often frustrating approach to assessing clinical risk. While the need for assigning risk is known to be critical, the traditional organizational approach to these risk estimates are often viewed as arbitrary at best and rarely provide insightful guidance for the team conducting the assessment. Start with the standard clinical “batting average” benchmarks from data providers, add a dose of team debate over potential tweaks, and you end up with a POS estimate barely distinguishable from industry norms. This leaves little room for meaningful insights that could otherwise balance risk mitigation with value effectively.
Surely there must be a more agile, accurate way—one that considers multiple relevant factors and delivers actionable insights to power R&D strategies.
Unleashing the Power of Machine Learning POS Models
Enter the era of data-driven POS models for biopharma R&D. By analyzing data from tens of thousands of clinical trials, machine learning models now can generate POS estimates tailored to strategic needs. Currently our models assign POS metrics to every active and planned trial, utilizing 14 distinct data elements to deliver clear predictions of trial success and insights into the underlying drivers of those predictions.
POS Benchmarks vs. Our Predicted POS Range by Disease
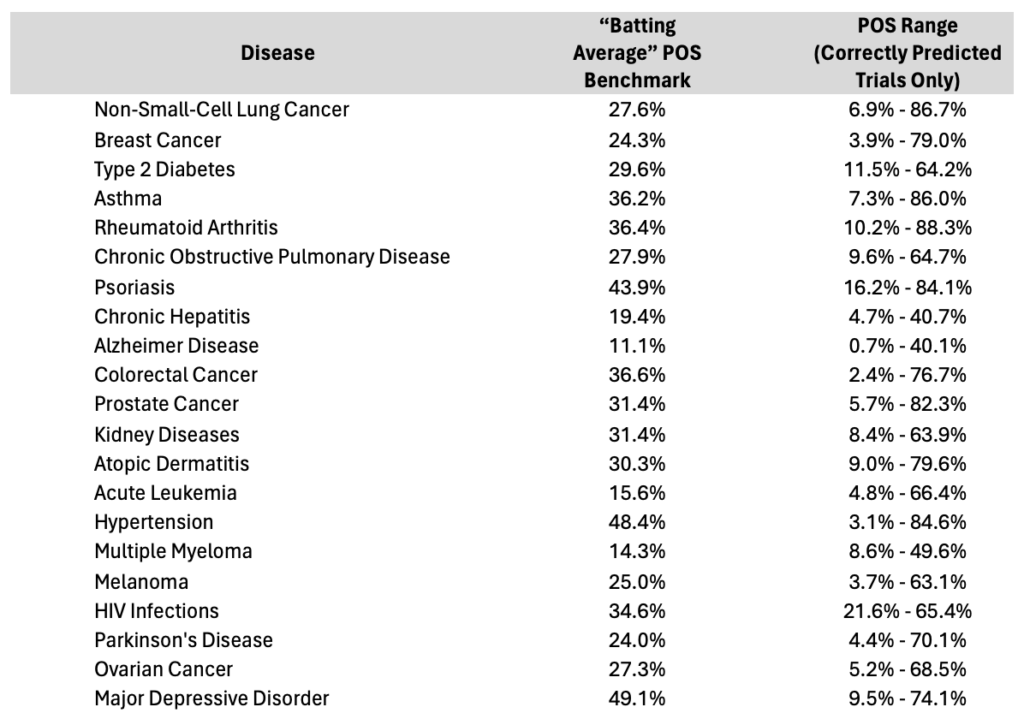
Table 1. List of disease areas in Phase 2with average POS benchmarks with range of correctly predicted clinical trials highlighting the magnitude of variance within a given indication and the need for a better approach to predicting clinical success beyond batting average benchmarking approaches.
In our previous post How Next-Generation Probability of Success Forecasting Can Improve Clinical Trial Accuracy by 44%, we introduced the foundational elements of our POS models. Today, we dive deeper with a specific focus on disease areas, revealing how this approach transforms traditional thinking. Sure, it’s widely accepted that lead trials are riskier, and that disease area is a key driver in predicting success. But to truly gauge potential outcomes and better stratify the risk found in each disease, we need more than just these basics. How do these 14 predictive factors stack up against a static “batting average” benchmark? The revelations across key disease areas are nothing short of transformative.
What’s clear from the data is that relying solely on industry disease averages is insufficient for articulating a trial’s potential risk. Until recent advancements, we lacked both a comprehensive understanding of risk range variance and a robust method for quantifying project-specific risks within those ranges.
Two key insights emerge here:
- The Phase 2 “hurdle” remains high: Across every profiled disease, Phase 2 remains a formidable hurdle, with the traditional “batting average” POS standing below 50%. Known as the “valley of death,” this phase is the most significant trial obstacle.
- A new strategic opportunity: The wide variability in POS predictions spotlights an unexplored opportunity for biopharma companies—to refine trial planning and optimize portfolio investments by focusing on better understanding the factors that enhance trial success.
Decoding Predictive Factors at the Disease Level
The POS model offers a unique lens into how various factors—like treatment modality, sponsor experience, and trial design elements—impact success across diseases.
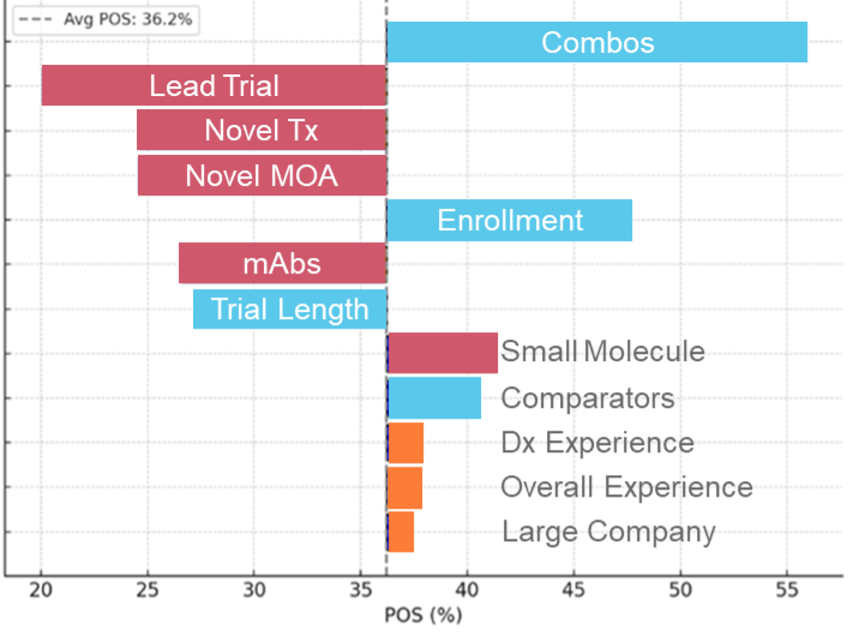
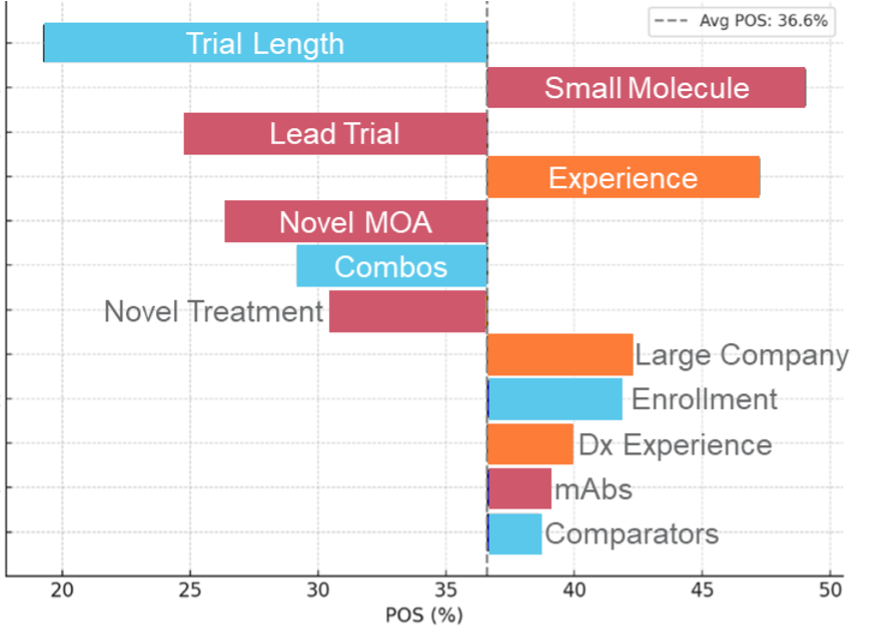
Presented here are tornado charts for each disease, centering on the average POS from our model. The horizontal bars illustrate how different predictive factors move the needle positively or negatively, unveiling the hurdles and drivers specific to each disease.
Asthma Tornado Chart
Colorectal Cancer Tornado Chart
Major Depressive Disorder Tornado Chart
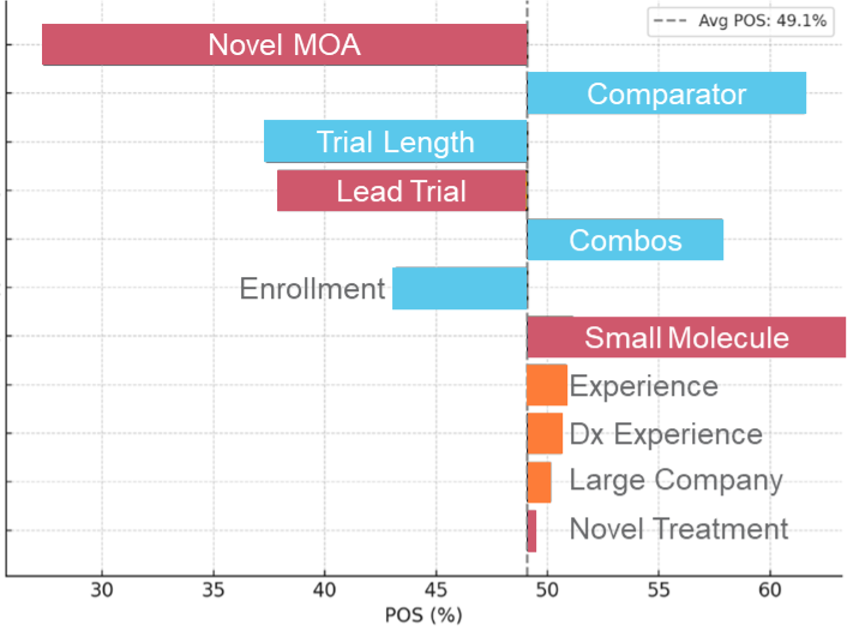
Illustration 1. Tornado charts highlighting the top Phase 2 drivers of POS assignment highlighting that the importance of each can vary in magnitude and even in some cases in direction of impact across indications.
Even a cursory glance at these phase 2 disease areas tornado charts reveals that multiple elements are at play in influencing clinical trial risk. Sponsor experience stands out; both within specific diseases and broadly, it consistently boosts POS, notably in solid tumors and autoimmune disorders. Molecule size also surprises—larger molecules generally exert a more favorable impact than smaller ones. Yet, small molecules paired with major sponsors also prosper (i.e. Colorectal Cancer).
As expected, lead trials commonly have a negative impact on the probability of success. However, this impact can vary widely across disease areas, with some like Atopic Dermatitis and COPD facing sharper negative effects. Intriguingly, trial comparators—a factor traditionally overlooked—offer a positive surge in success probability, challenging conventional thought.
To better demonstrate how this relates to the actual POS assignment for a given disease area, we highlight a range of POS assignments in Colorectal Cancer below and describe the factors driving the POS assignment.
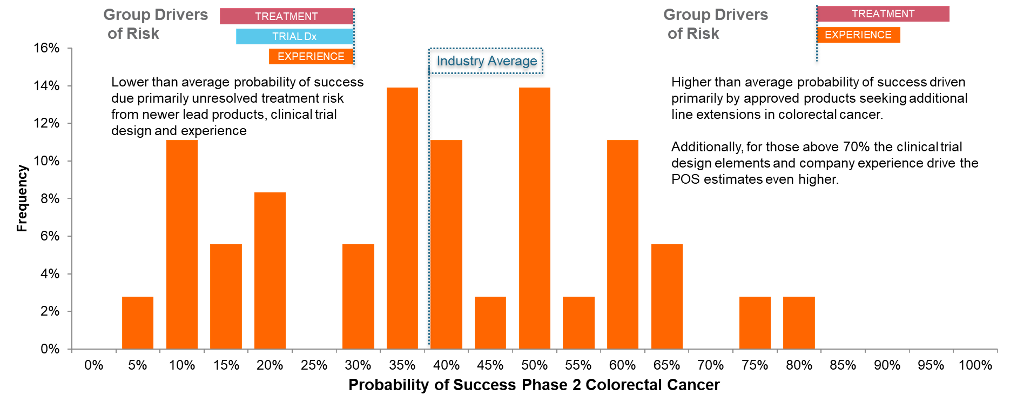
Illustration 2. An example of the POS variance within the colorectal cancer indication illustrating the impact of the drivers on the POS assignment in this indication.
Predictive Categories – Impact Across Therapy Areas
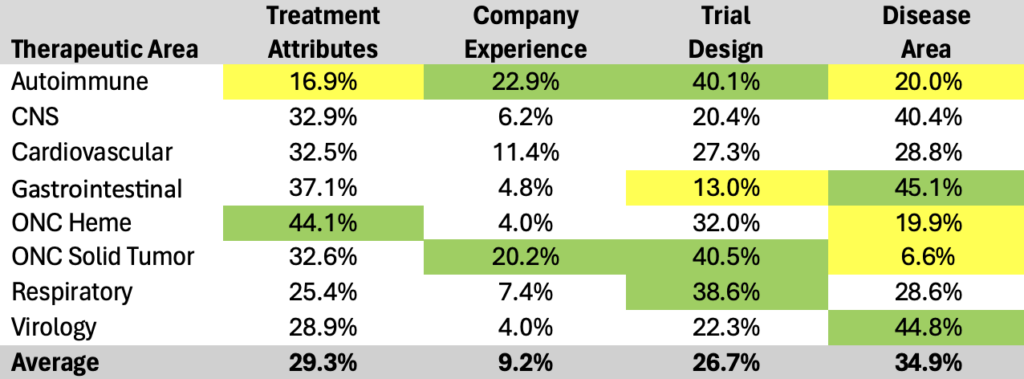
Table 2. Therapeutic area examples summarizing the influence across the four general categories of drivers for probability of success predictions.
Analyzing the current 14 data elements within their four main categories uncovers additional nuanced insights when explored across therapy areas:
- Drug Characteristics: Averages a 29% predictive power, critical across all therapeutic areas, spanning from 44% in Oncology Hematology to 17% in Autoimmune.
- Sponsor Experience: Stands at a 9% average predictive power, proving less influential—except in Autoimmune and Oncology Solid Tumor—ranging from 23% in Autoimmune to a mere 4% in Oncology Hematology and Virology.
- Trial Design: Holds a 27% predictive power, vital especially in Autoimmune, Oncology Solid Tumor, and Respiratory.
- Trial Indication: Commands the highest average predictive power at 35%, crucial across most areas except Oncology, with notable importance in CNS, Gastrointestinal, and Virology.
The analysis places therapeutic areas into distinct segments:
- Trial Design-centric: Encompasses Autoimmune, Oncology Solid Tumor, and Respiratory.
- Drug Characteristics-centric: Enfolds Oncology Hematology.
- Trial Indication-centric: Covers Gastrointestinal and Virology.
- Balanced Approach: Engulfs CNS and Cardiovascular, balancing emphasis across Drug Characteristics, Trial Design, and Trial Indication, minimizing Sponsor Experience.
A Continuous Evolution and Strategic Rethink
This revolutionary data-driven POS modeling does more than refine the approach and insights in assessing clinical risk—it opens the door to entirely re-envisioning clinical planning, trial design, and portfolio strategy. By perpetually integrating new data, the industry can sharpen POS accuracy and garner strategic insights through time.
We’re merely scratching the surface of what POS models can achieve. As they evolve—both broadly and as bespoke solutions—this approach promises to elevate clinical R&D strategies, foster smarter investments, and improve the odds of successful therapies reaching the market.
Join us next as we explore these models through a company-level lens, dissecting risk drivers and crafting risk-adjusted values for our top 20 companies. Stay tuned for what’s next…
