
The Importance of a High-Performing Clinical Trial Partnership
Pharmaceutical companies are heavily dependent on clinical trials to assist with the placement, promotion, and sales of their products. If they are introducing a new mechanism of action (MOA) or modality into the market, partnering with a research facility that meets three key criteria is critical.
Three primary drivers outside of compliance any pharmaceutical company should use to identify a good match with a clinical research organization (CRO) are:
- Ability to recruit targeted patient populations in substantial numbers
- Alignment with high-performing clinics and facilities
- Association with top key opinion leaders (KOLs)
Research facilities primarily handle recruitment efforts, enrollment rates and patient participation, and to stay competitive and expedite your product’s speed to market, it is essential to partner with a CRO that fulfills the above three drivers.
Using our clinical trial data services such as data analysis and prediction models, OZMOSI can help pharmaceutical companies identify CROs that are excellent matches for their proposed clinical trials. We recently conducted research on clinical patient demand, recruitment rates, and enrollment for companies conducting trials on Crohn’s Disease (CD), and through our findings were able to identify several insights regarding trials in this therapeutic area. These included:
- CD trial growth percentages for Phase 1 through Phase 4
- Patient demand increases for Phase 1 through Phase 4
- Enrollment rates for Phase 2 and 3 trials and that correlation to number of facilities
- Leading trial completion and patient enrollment rates by company
Crohn’s Disease Trial Growth Between 2015-2021
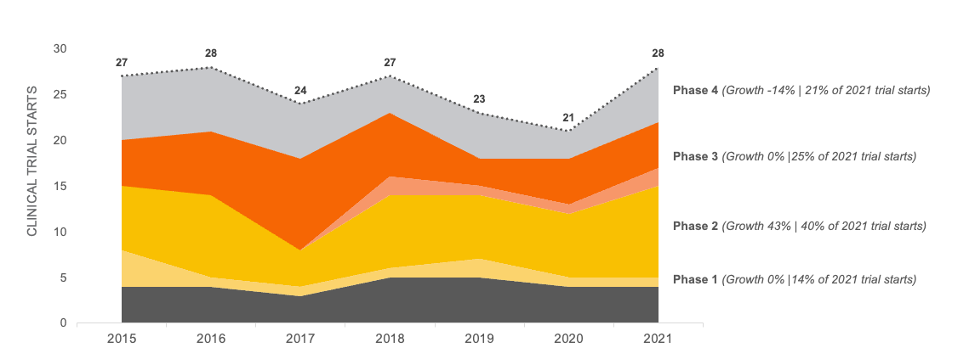
Based on our data analysis in November of 2022 of all clinical trial starts for Crohn’s Disease that were testing pharmaceutical treatments, we discovered clinical trial starts increased by only 4% between 2015 and 2021. Note this data does not include pediatric trials or geography specific trials.
Trial starts in this therapeutic area appears to be steady at approximately 25 trial starts per year. However, a recent bolus of Phase 2 activity will likely increase Phase 3 activity, which will result in higher patient demand in the near future.
CROHN’S DISEASE CLINICAL TRIAL STARTS 2015-2021
Demand for Patients Per Trial is Increasing
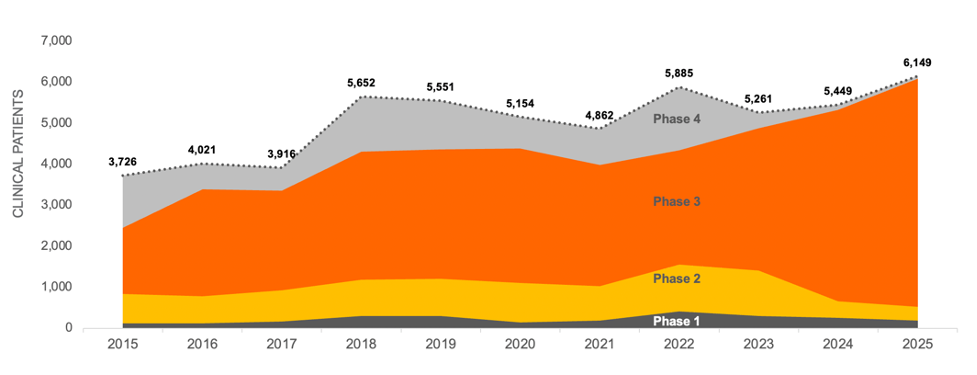
Using the same data, we allocated patient demand for each trial evenly by month for the duration of recruitment and totaled that by year. Projecting the current Phase 1 and Phase 2 trials on a risk-adjusted basis into the next phase of development shows that while trial starts for CD remain steady, the average number of patients per trial appears to be increasing across all trial phases and is forecasted to continue at this rate through 2025. This increased competition for patients could drive a significant increase in the total time needed for recruitment, which will also affect costs.
CROHN’S DISEASE CLINICAL TRIAL PATIENT DEMAND 2015-2025
Enrollment Rates Per Facility for Completed Trials
Knowing how well each facility is performing at clinical trial recruitment and ultimately enrolling patients into trials can help guide pharmaceutical companies in their search for the best CRO partner. Correlating that to the number of facilities can provide insight into which facilities are excelling in their recruitment and enrollment efforts.
GENERAL STATISTICS FOR COMPLETED CROHN’S DISEASE TRIALS
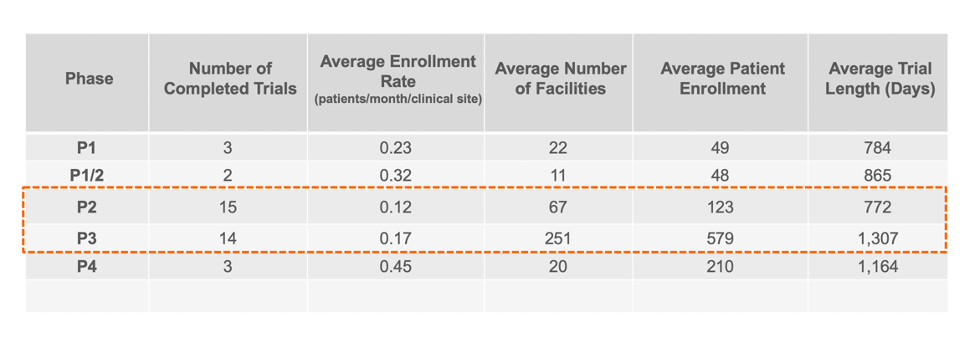
Based on our summary statistics which focused on masked enrollment, non-pediatric industry trials, the patient enrollment rate appears to be roughly .15 patients per month per facility for Phase 2 and 3 clinical trials. When correlated to the number of facilities, the general rule of thumb for Phase 2 and 3 appears to be approximately one clinical facility for every two patients. However, further analysis showed that simply increasing the number of facilities to patients does not appear to drive increased enrollment rates.
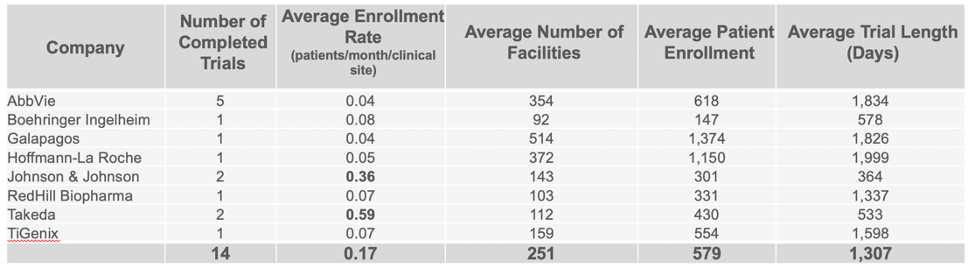
Companies Leading in Enrollment Rates in Phase 2 and 3 Trials
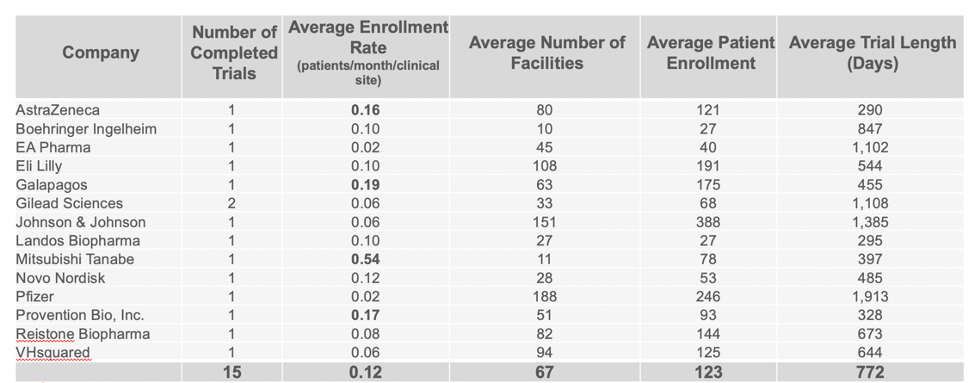
Continuing to use the same data set, we were able to identify the companies who are clearly standing out above the rest when it comes to enrollment in completed CD trials. Taking in account multiple variables such as the average number of facilities used, patient enrollment numbers, trial length, and number of completed trials, our analysis identified Mitsubishi Tanabe as clearly leading in enrolling patients in Phase 2 trials, with Takeda leading in Phase 3 trials.
PHASE 2 COMPLETED CROHN’S DISEASE TRIALS BY COMPANY
PHASE 3 COMPLETED CROHN’S DISEASE TRIALS BY COMPANY
Evidence suggests that there are various approaches to clinical site selection that result in better recruitment rates for some companies over others. Balancing the need for exposure to high demand KOLs and competing with other companies who are looking to complete a successful clinical trial in the same therapeutic area is a challenge all companies face.
The next step we recommend here is to the analyze this data at the clinical site level to expose site level performance and key metrics for optimizing clinical site selection that is best aligned with your clinical, operational, and strategic goals.
Let OZMOSI’s Clinical Trial Data Services Optimize Your Recruitment and Enrollment Efforts
If you find you are planning to conduct a Phase 2 or Phase 3 trial and are challenged with finding patients and optimizing your clinical trial recruitment and enrollment efforts, OZMOSI can help. Our data analysis can help you identify the best set of facilities to engage with and help you prioritize the onboarding of the facilities you decide to go with.
By conducting a ranking analysis of facilities involved in trials in your therapeutic area, we help our clients optimize the best set of clinical facilities. We base this on historical enrollment performance across companies, balanced with facility selection to maximize KOL impact and exposure. And by using factors such as historical enrollment rates across companies, primary intelligence, and location and facility statistics, we can also help prioritize facility onboarding for optimal enrollment that balances exposure to KOLs and speed of recruitment.
Reach out today if you’d like to learn more about our clinical trial data capabilities and how our pharmaceutical intelligence platform delivers data you can use to drive strategic clinical trial decisions.